Configuring Prometheus
hping.ru supports exporting metrics and check statuses to Prometheus, for use with Grafana.
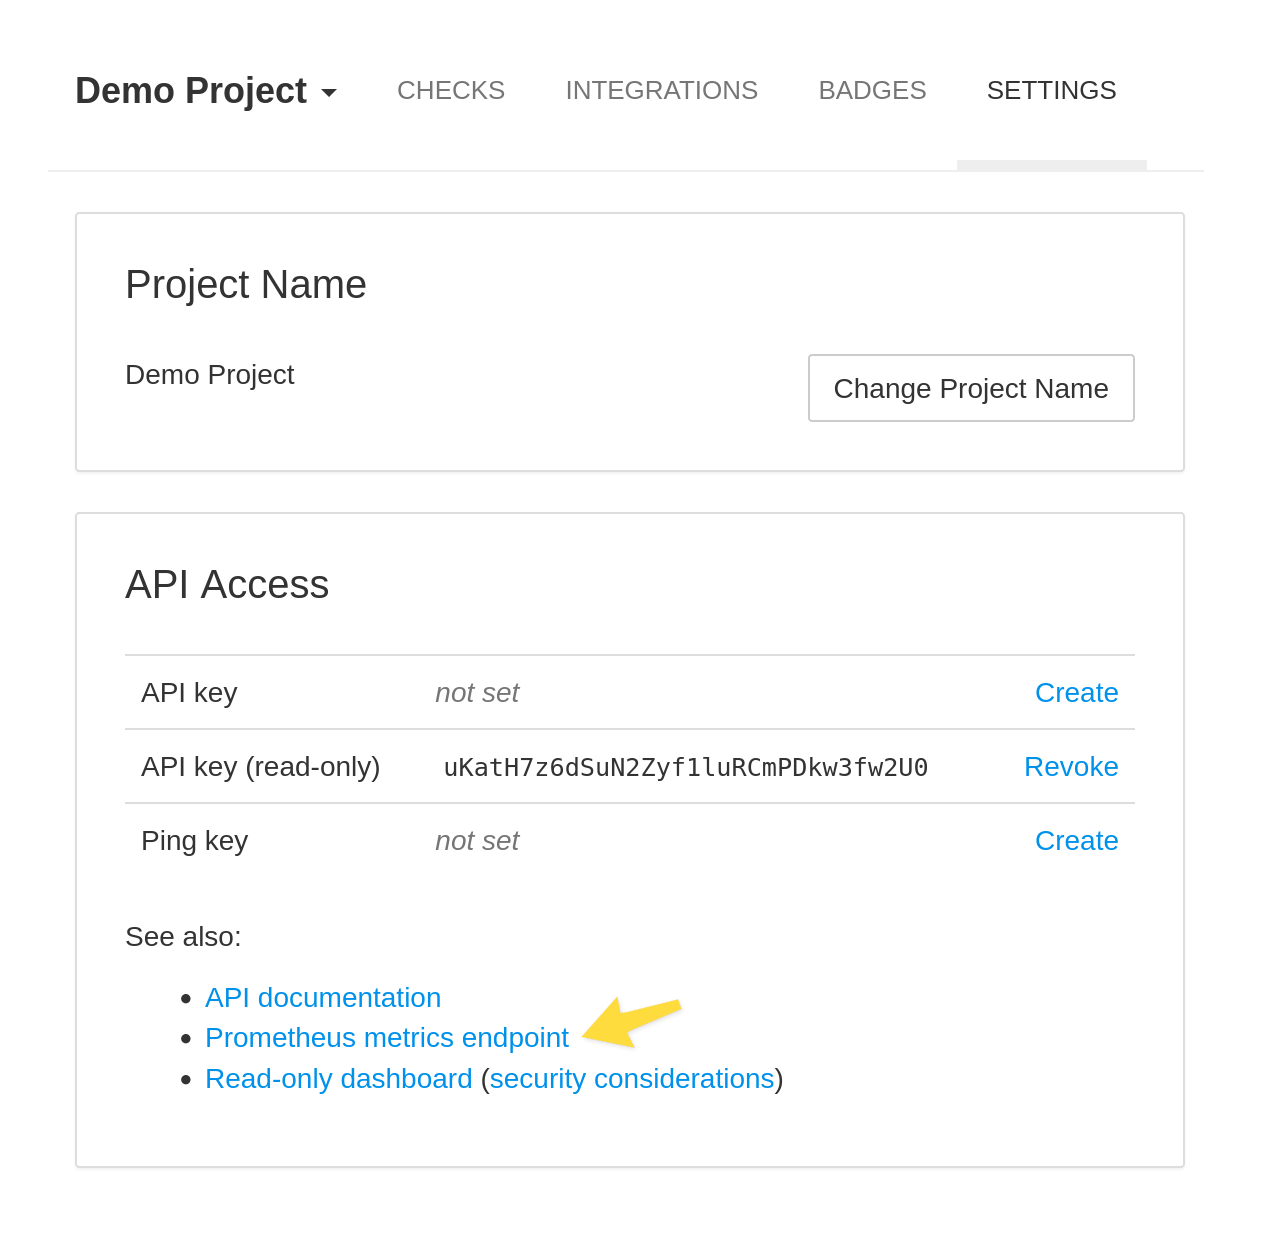
You can generate the metrics export endpoint by going to your project settings and creating a read-only API key. You will then see the link to the Prometheus endpoint:
Update the prometheus.yml
You can copy the Prometheus endpoint URL and add it to the Prometheus configuration:
  - job_name: "healthchecks"
    scrape_interval: 60s
    scheme: https
    metrics_path: /projects/{your-project-uuid}/metrics/{your-readonly-api-key}
    static_configs:
      - targets: ["hping.ru"]
Notice how we split up the URL and paste in the scheme, domain, and path separately.
Reload Prometheus, and your changes should be live, coming in under the hc_ prefix.
Available Metrics
The Prometheus metrics endpoint exports the following metrics:
- hc_check_up
-
For every check, indicates whether the check is currently up (1 for yes, 0 for no).
Labels:
name– the name of the checktags– check's tags as a text string; multiple tags are delimited with spacesunique_key– a stable, unique identifier of the check (derived from the check's code)
- hc_check_started
-
For every check, indicates whether the check is currently running (1 for yes, 0 for no).
Labels:
name– the name of the checktags– check's tags as a text string; multiple tags are delimited with spacesunique_key– a stable, unique identifier of the check (derived from the check's code)
- hc_tag_up
-
For every tag, indicates whether all checks with this tag are up (1 for yes, 0 for no).
Labels:
tag– name of the tag
- hc_checks_total
- The total number of checks.
- hc_checks_down_total
The number of checks currently down.
Constructing URLs to Check Details Pages
You can use the unique_key labels to construct URLs to check's
details pages in hping.ru. Construct the URLs like so:
https://hping.ru/cloaked/{unique_key}/